
The Cartesian Plane: Managing the Vectors of Growth
One of the great paradoxes of the modern tech company is that we have never had more data, yet teams have never felt more misaligned.
The Head of Product is celebrating because the new feature shipped two weeks early. The Head of Sales is furious because the feature doesn't solve the enterprise client's problem. The marketing team is cheering over a 50% spike in website traffic, while the CFO is staring at a flat revenue curve.
Everyone is moving incredibly fast. Everyone is hitting their individual KPIs. But the company itself feels like it is spinning in circles.
The problem is that the company is measuring speed, but it is failing to measure velocity. Speed is how fast you are moving. Velocity is how fast you are moving in a specific direction.
To fix this misalignment, the Chief Wise Officer must look to the 17th century, when René Descartes was lying in bed, staring at a fly on his ceiling, and accidentally invented the single greatest tool for mapping reality: The Cartesian Plane.
The Marriage of Algebra and Geometry
The legend goes that Descartes, who was often sickly and spent his mornings in bed, watched a fly buzzing around his room. He realized that at any given moment, he could describe the exact position of the fly by measuring its distance from two intersecting walls.
By drawing a horizontal line (the X-axis) and a vertical line (the Y-axis), he could plot any point in space using two simple numbers.
This was a monumental breakthrough. Before Descartes, algebra (equations) and geometry (shapes) were two completely separate fields of math. Descartes merged them. He proved that you could take an abstract, messy reality (a shape) and perfectly describe it using rigorous, quantifiable data (an equation).
For the modern executive, the Cartesian Plane is not just a mathematical tool; it is the ultimate framework for strategic alignment.
Plotting the Strategic Vector
In business, your "Geometry" is your corporate vision the abstract shape of what you want the company to become. Your "Algebra" is your data, the daily metrics, tickets, and revenue numbers.
If you do not map your data onto your vision, you get chaos.
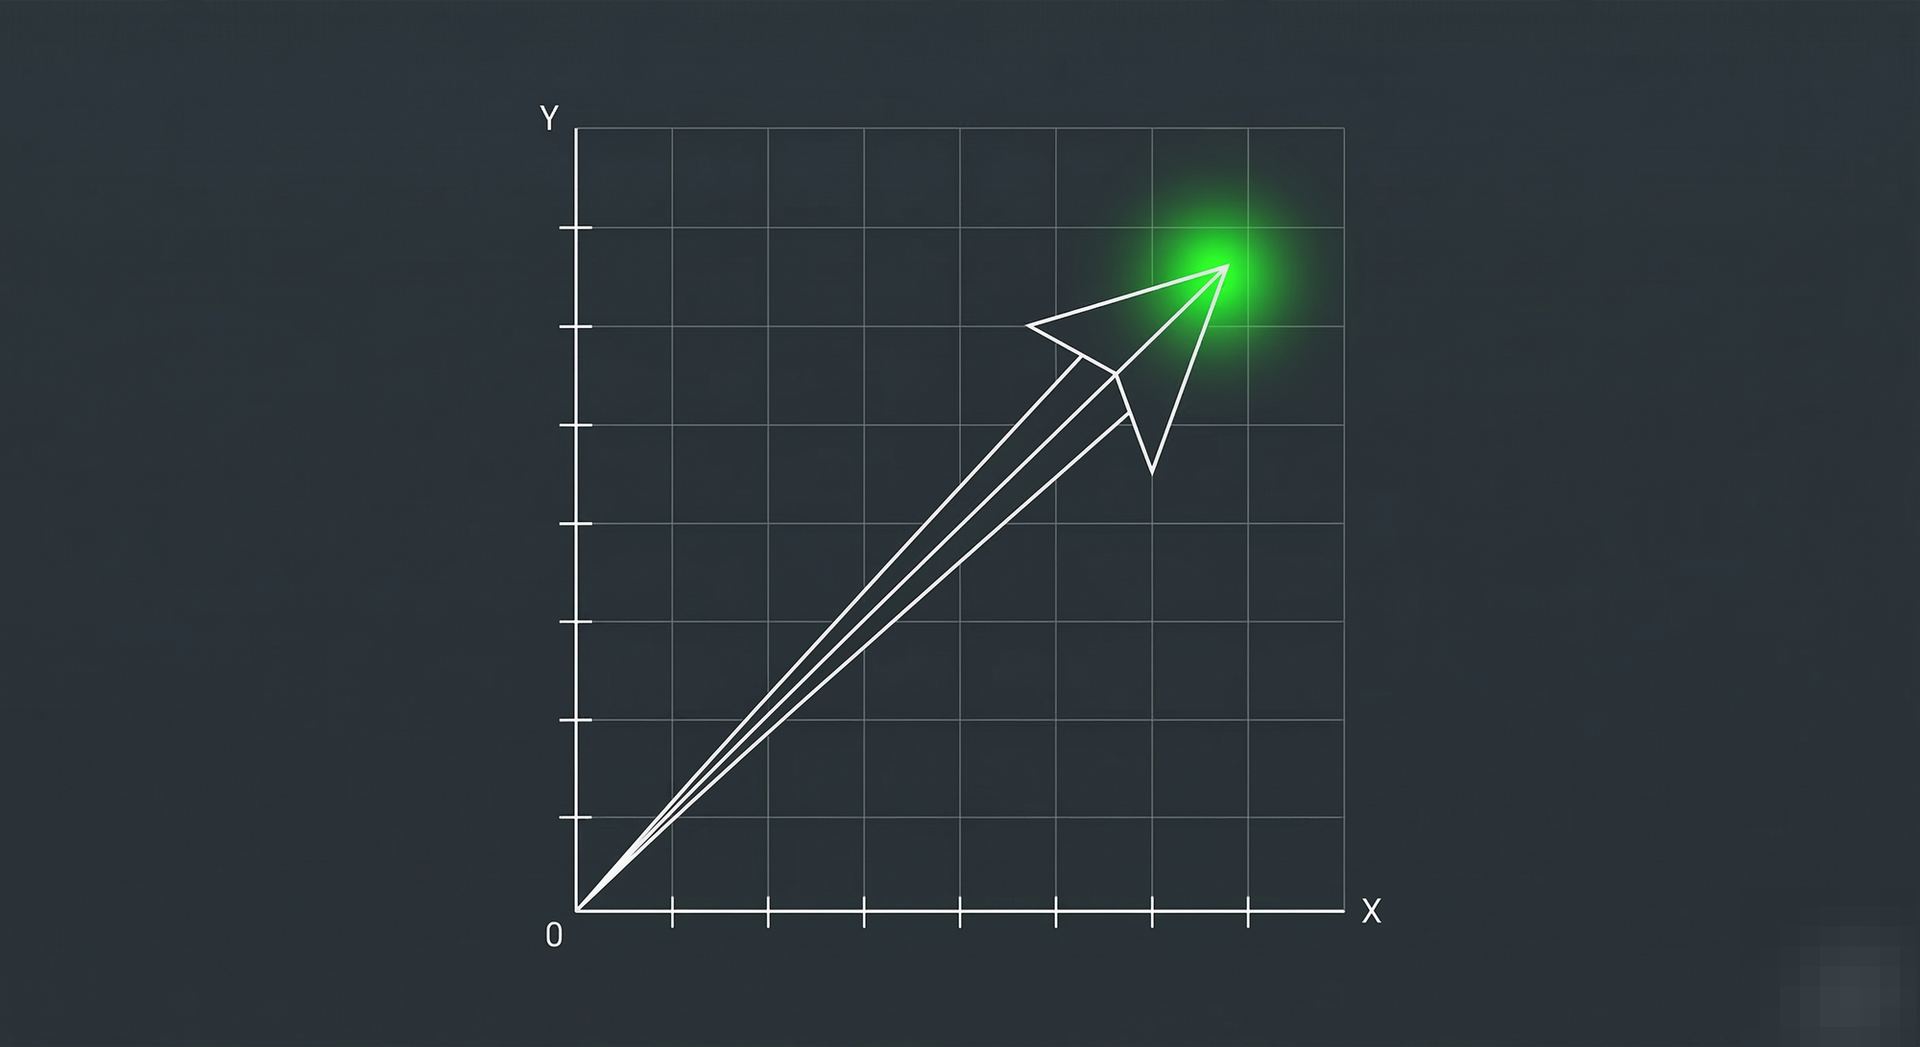
When a team just looks at isolated numbers on a dashboard, they are optimizing for speed. But when you plot those numbers on a Cartesian plane, you create a Vector. A vector is an object that has both magnitude (speed) and direction.
If the engineering team works 80-hour weeks to ship a feature that the market doesn't actually want, their magnitude is massive, but their direction is entirely wrong. The resulting vector points the company away from its destination.
The CWO Strategy: The Alignment Grid
The Chief Wise Officer uses the Cartesian concept not to micromanage, but to grant teams ultimate autonomy while ensuring perfect alignment.
1. Define the Axes of the Business Dashboards with 50 different metrics create cognitive overload. You must define the X and Y axes of your company's current growth stage. What are the two competing, primary variables that define success right now? For an early-stage SaaS product, the X-axis might be "User Retention" and the Y-axis might be "Feature Velocity." Every single initiative the company undertakes must be plotted on this grid. If a project increases feature velocity but heavily degrades user retention, you can instantly see the vector pointing in the wrong direction.
2. Manage the Vector, Not the Steps Once the grid is defined and the destination (the upper-right quadrant) is clear, the CWO steps back. You do not tell your brilliant engineers or marketers how to walk the path. You simply tell them: "Here are our current coordinates. Here are the coordinates we need to reach by Q3. Chart your own path, but your resulting vector must point toward that destination." This empowers the team while maintaining strict strategic alignment.
3. Identify the Orthogonal Teams Orthogonality means moving at right angles. In a company, orthogonal teams are working incredibly hard, but their efforts are completely perpendicular to the company's main goal. If your goal is enterprise security, but your marketing team is running viral TikTok campaigns for teenagers, their vector is orthogonal to the product. Use the grid to identify these misalignments and quickly redirect their energy before capital is wasted.
Conclusion: The Map of Progress
Data without direction is just noise.
When your teams feel disconnected and chaotic, do not add more KPIs to their plates. Follow Descartes' lead. Draw a simple grid. Define the axes. Plot your current position, and point to where you want to go.
When everyone in the company understands the Cartesian plane they are operating on, you stop fighting over who is running the fastest, and you finally ensure that everyone is pulling the company in the exact same direction.
No spam, no sharing to third party. Only you and me.


Member discussion